
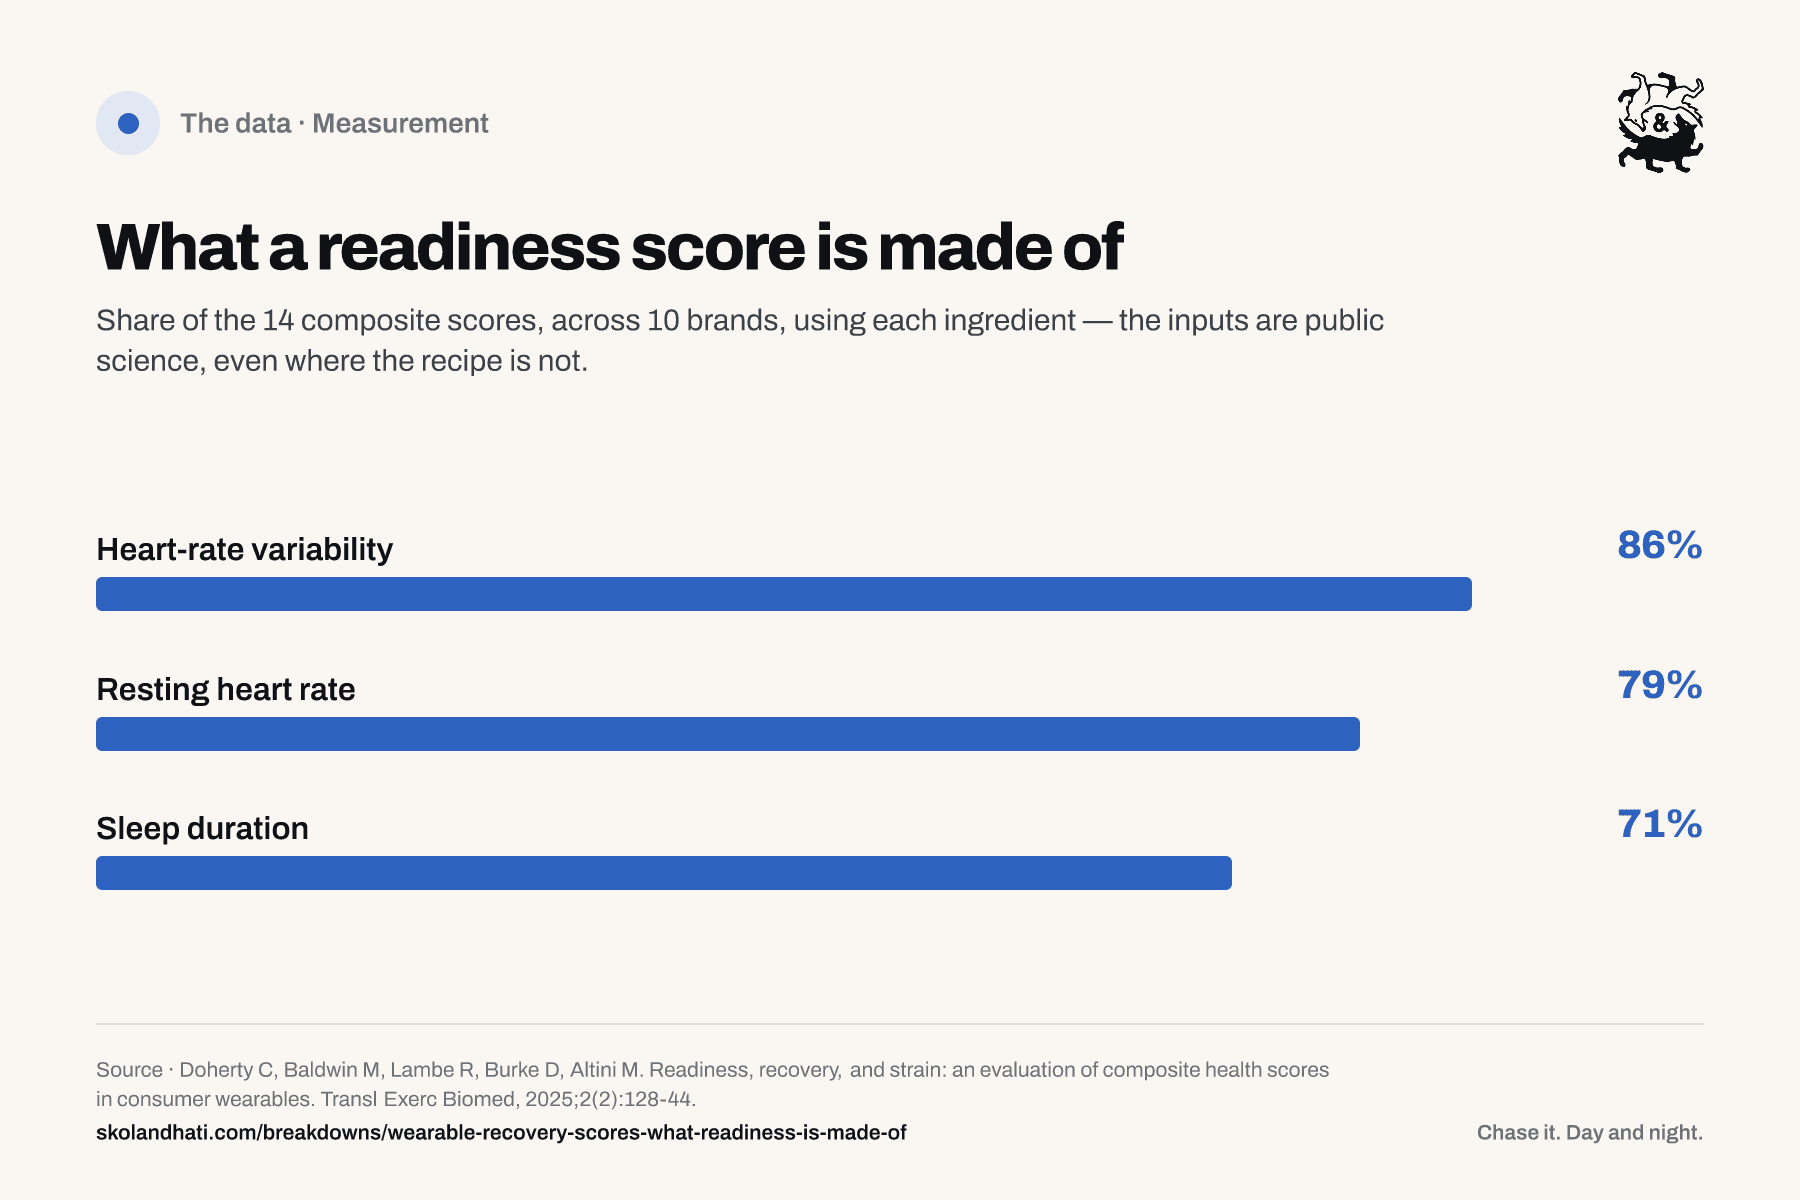
A readiness score is several overnight numbers blended into one. Across 10 major wearable brands, a 2025 review counted 14 of these composite scores: HRV feeds 86% of them, resting heart rate 79%, and sleep 71% [1]. No brand publishes the exact recipe, and few have peer-reviewed validation [1]. The ingredients are worth reading. The blend you take on trust.
01What goes into a readiness score?
Most scores blend four inputs — HRV, resting heart rate, sleep, and recent activity — and HRV appears in 86% of the composite scores one review counted [1].
Every brand names its blend differently: readiness, recovery, energy. Under the hood, the ingredients repeat. A 2025 review in Translational Exercise Biomedicine examined 10 major wearable brands and found 14 distinct composite scores between them [1]. HRV fed 86% of those scores, resting heart rate 79%, and recent physical activity and sleep duration 71% each [1].
Think of a spice blend. The jar lists the ingredients but not the amounts, and every brand mixes its own. The parts here are familiar: what your watch reads overnight as HRV, your overnight pulse, your sleep hours, and how hard yesterday was. The mixing — which input counts most, over what window, scaled how — is the part no brand in the review disclosed [1]. Visible ingredients, private recipe. That split is the whole story of this page.
02Does training by HRV actually work?
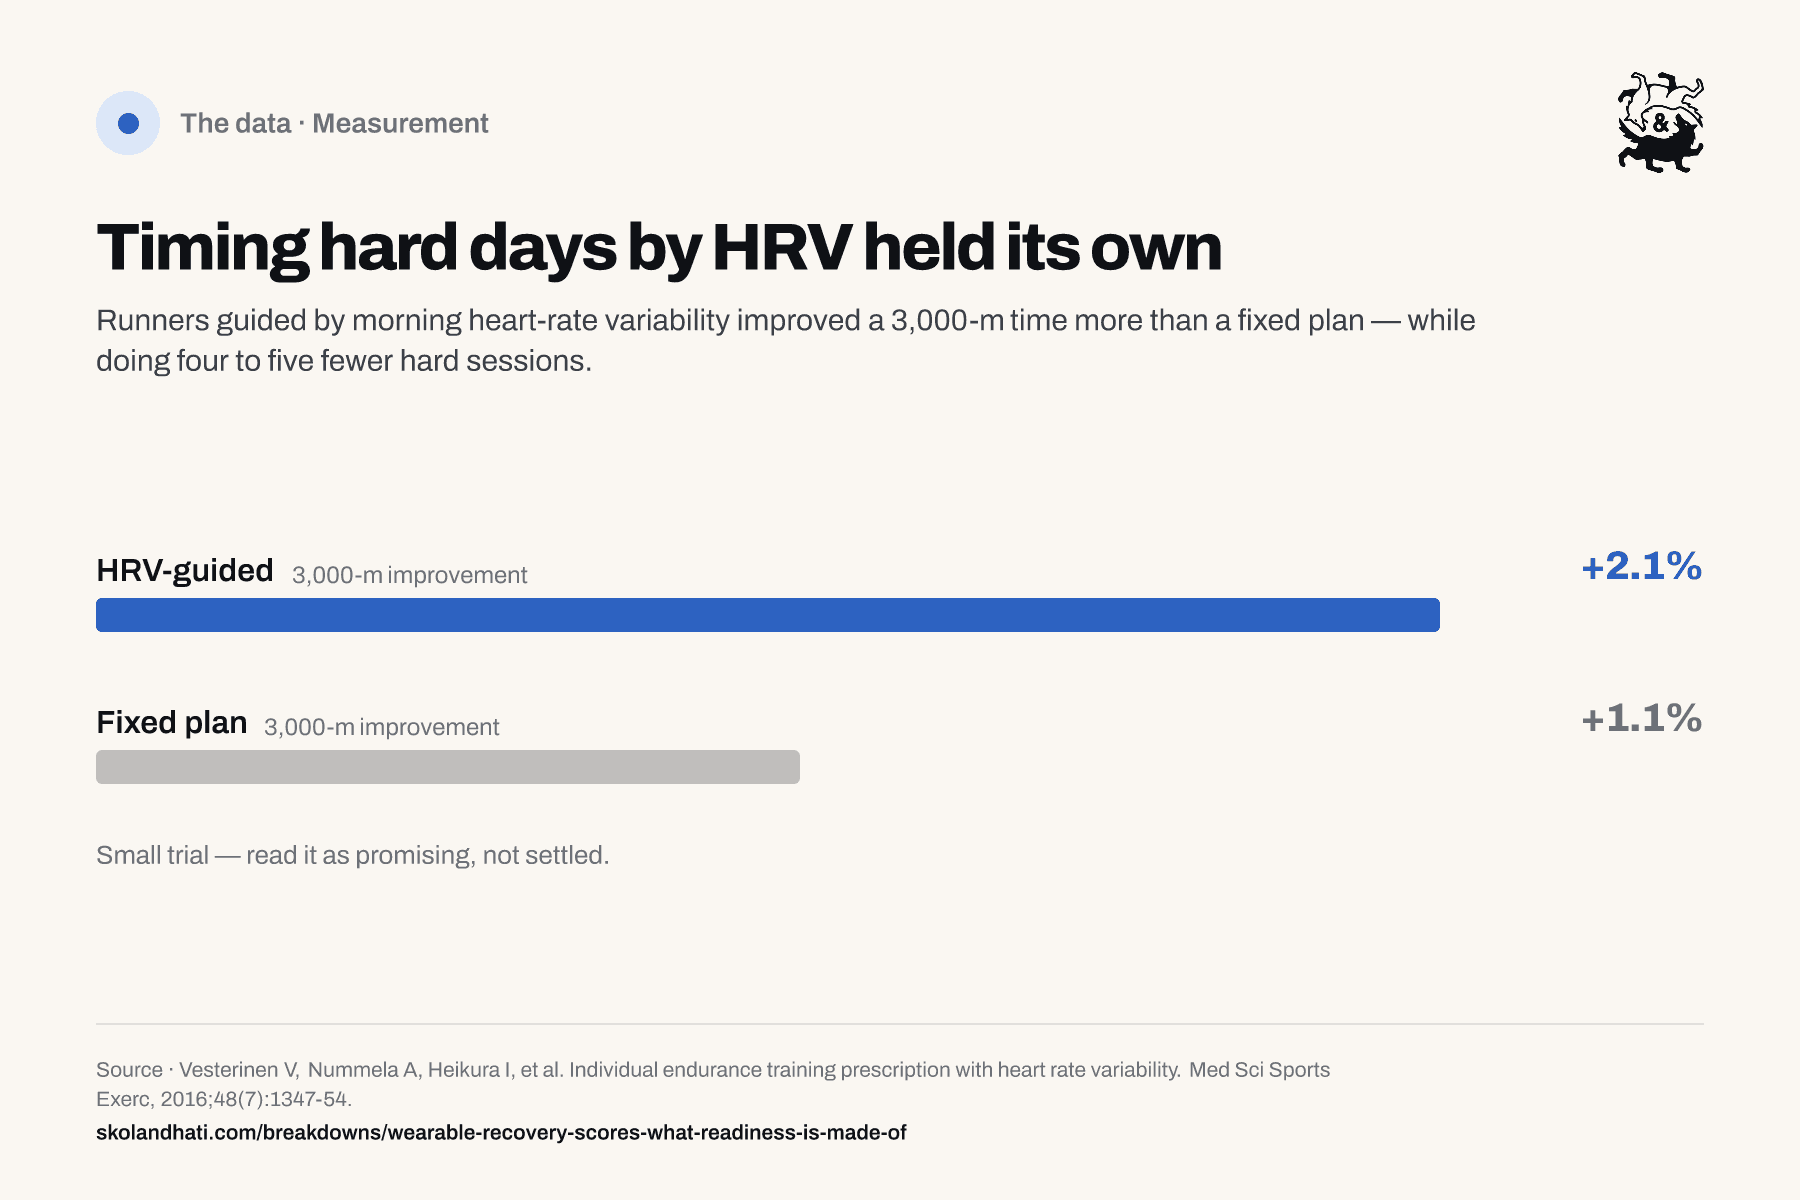
In small trials, timing hard days by morning HRV matched or beat a fixed plan — one group improved a 3,000-m time 2.1% while doing four to five fewer hard sessions [3].
The best-tested ingredient is HRV, read each morning against your own recent baseline. In a 2007 trial, 26 moderately fit men trained for four weeks. The group whose hard days were scheduled by morning HRV gained about 4 ml/kg/min of VO2peak; the fixed-plan group's change was not significant [2]. A 2016 study ran the same comparison with 40 recreational runners over eight weeks. The HRV-guided group improved its 3,000-m time by 2.1% versus 1.1% — while logging 13.2 hard sessions to the fixed plan's 17.7 [3].
A 2021 meta-analysis pooled these trials and cooled the story down. HRV-guided training clearly won at one thing: the vagal HRV indices themselves improved more, a moderate effect [4]. For VO2max and endurance performance, the edge was small and not statistically significant [4]. The honest read is efficiency: similar fitness from fewer hard days, on average. One more thing matters. These trials used dedicated morning readings and a transparent rule — not a branded composite score.
By signing up you agree to receive our emails, including occasional offers, and to the privacy policy.
03Has anyone validated the composite score itself?
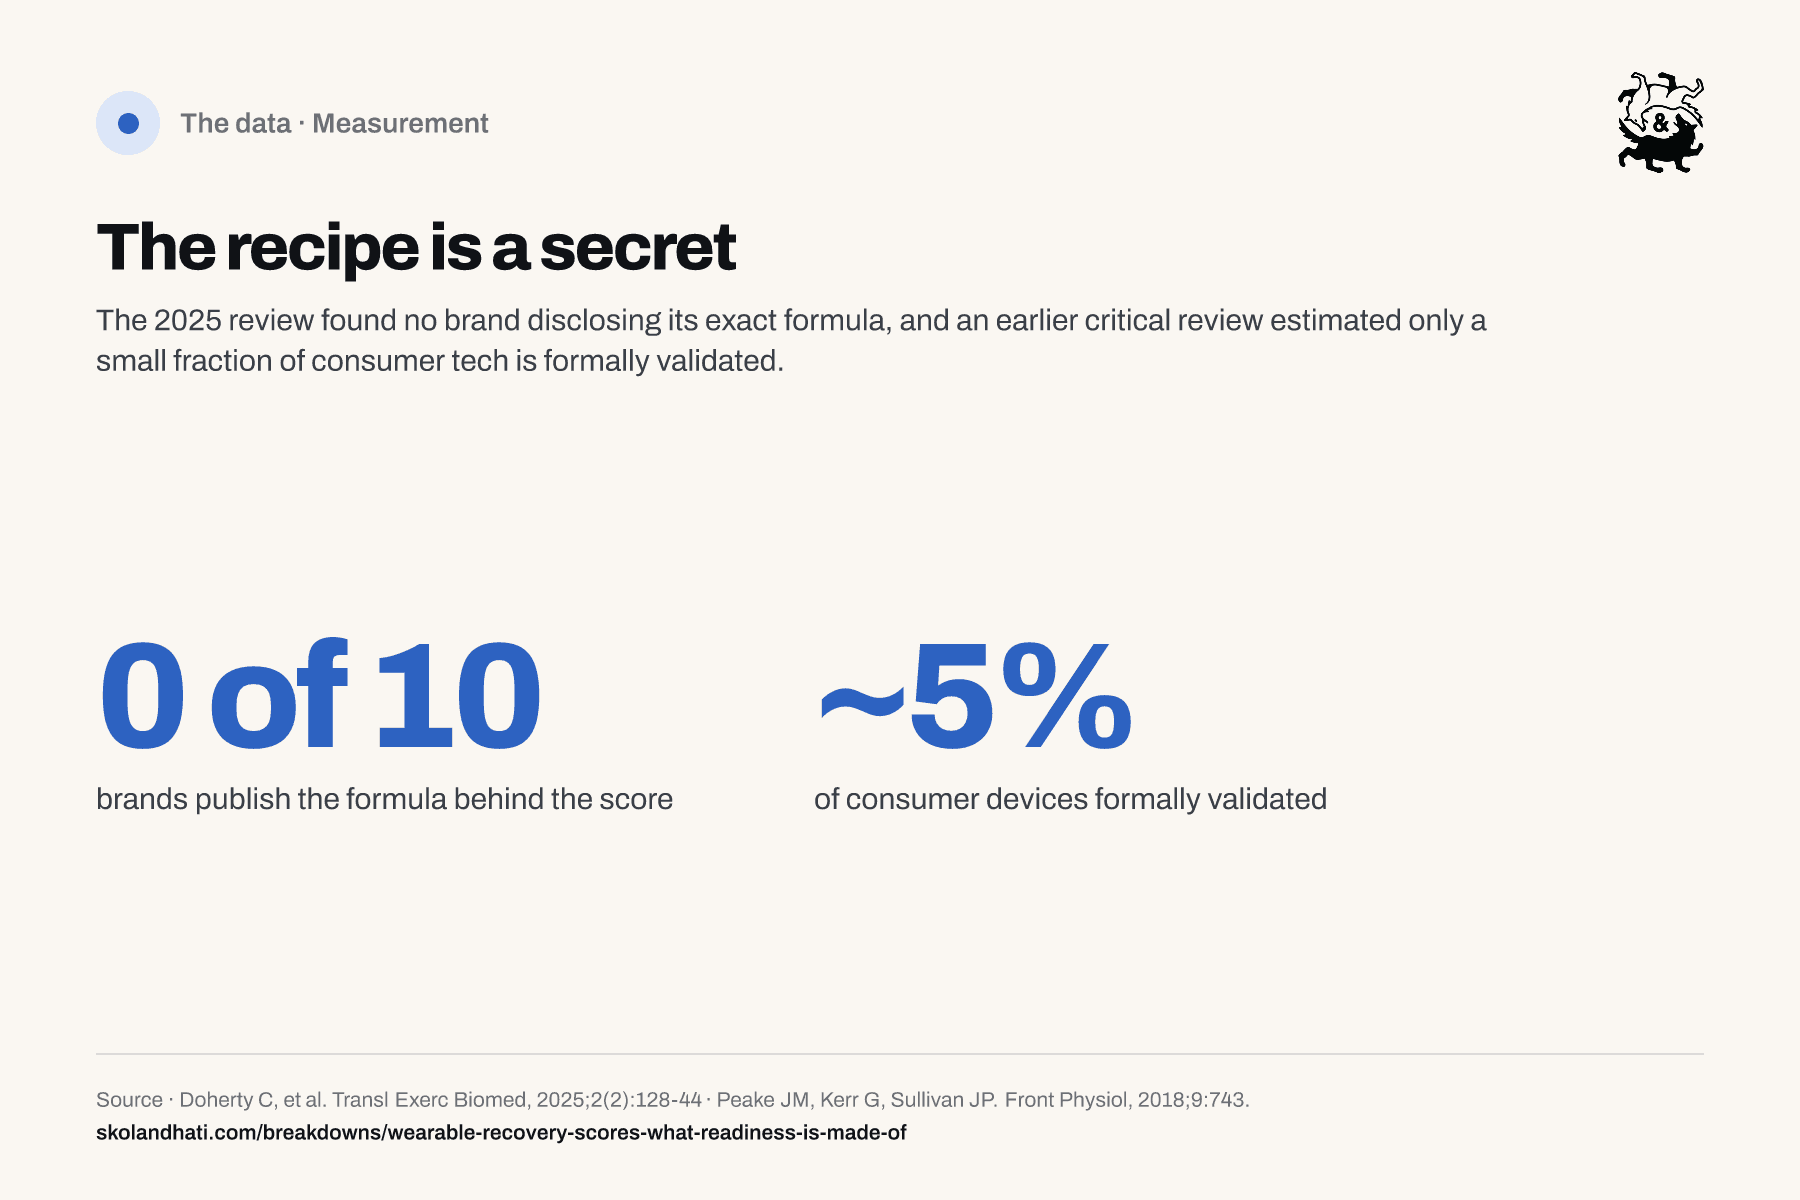
Mostly no — the 2025 review found no brand that disclosed its exact formula, and few offered peer-reviewed evidence behind the composite number [1].
Here is the sentence this article hangs on: the direct evidence on composite readiness scores is thin, and the review that went looking said so [1]. Across all 10 brands, none disclosed the exact algorithm, and few provided empirical, peer-reviewed validation of the score itself [1]. That is not the same as the sensors being wrong. It means the blend — the weighting, the time window, the scaling to a tidy 0 to 100 — has mostly not been checked by anyone outside the company that sells it.
This is an old pattern in the category. A 2018 critical review of consumer devices for stress, recovery, and sleep estimated that only about 5% of the technologies had been formally validated [5]. Part of the problem is structural. There is no lab gold standard for “readiness,” so there is nothing to hold the number up against. A blood-pressure cuff can be proven wrong. A readiness score can only disagree with you.
04How should you actually use the number?
Read the inputs you can see against your own baseline — resting heart rate trend, HRV trend, sleep hours — and let the branded single number be commentary.
The protocol that survives the evidence is plain. Trust the ingredients you can see, each against your own baseline. Your resting heart rate trend. Your HRV trend versus your own recent normal, because the raw value means little against anyone else's. Your sleep hours, honestly counted. A 40-minute commute is terrible or great depending on what your usual is; every one of these numbers works the same way. It is the same habit that serves you across the rest of your numbers.
It is also where experienced users land. One study interviewed 17 people who had worn a score-producing band or ring for at least three months [6]. They described starting from the score and drifting toward their own judgment. “You can't really capture the complexities of a human on a device,” as one put it. A low score on a morning you feel good is a tiebreaker question, not a verdict. And the boring inputs still outrank the packaging: sleep and easy days sit at the top of the recovery hierarchy with or without a wearable.
What is a wearable readiness score based on?
Are readiness scores accurate?
Should I skip a workout when my score is low?
Is HRV-guided training better than a fixed plan?
General-audience information — not medical advice. Skol & Hati builds a training app. Read anything here about apps with that in mind. This page discusses score-bearing products as a category and names none for ranking; study devices appear only where cited research used them. General education, not medical or training advice — how any number applies to you is your doctor's read. How we source and verify. No affiliate links in this breakdown. Published 2026-09-28.
HRV: what your watch is actually measuring
The gaps between your heartbeats, the math your watch runs on them, and why the number only means something compared with your own baseline.
5 min · September 5, 2026MeasurementResting heart rate: the free recovery metric you already wear
What normal looks like, what moves it overnight, and why a week of mornings beats any single reading.
5 min · September 5, 2026